IS415 Project - Project Proposal
1 Motivation of the Project
The price of the resale HDB market has always been on the rise and have seen tremendous growth over the years. With HDB being an integral part of Singaporeans’ life, it would make sense that the affordability of the HDB is extremely important to the everyday Singaporeans. However, with new such as “HDB resale prices accelerate in Jan as million-dollar deals surge by 42%: SRX, 99.co”or “HDB resale prices rise 2.3% in Q4, slowest increase in 2022”. All this news only serve to highlight the importance of resale flat and the ever growing concern that as time passes, HDB will become more and more unaffordable to us.
2 Goals of the Project
Now that we have properly establish what our Motivation is we would like to discuss the main goals of the project.
Our first goals is to find if there is any correlation between the different amenities HDB has an effect on the price of the resale flat. The data set can be found in the link provided:
Rail Station:It is commonly believed that the price of the resale flat is closely related to how close the HDB is to our Rail Station, as being close to the rail station means it is more convenient to travel. We would expect that the closer the rail is to the hdb, the higher the value
Hawker Centers:Hawker Centers are where almost all Singaporeans get their food from. It would make sense that we expect that the closer the Flat is to the Hawker Center the more expensive the flat will be.
Preschool (Childcare/Kindergarten):Childcare center is especially important to parents with young children and we believe that parents are willing to pay more to have one nearby. It would make sense that we expect that the closer the Flat is to the pre-school the more expensive the flat will be.
Malls:Hawker Centers are where almost all Singaporeans do their favorite pastime . It would make sense that we expect that the closer the Flat is to the Malls the more expensive the flat will be.
Mosquito Hotspots:We found this data set but we are not sure if there is any correlation. We would expect that since Mosquito spreads dengue fever, a high population will make the flat cheaper.
Our Second Goal is to make use of the above factors to predict the value of hdb resale flat for a given area given using geographically weighted regression models.
- HDB Resale Data set:Contains all the relevant data about HDB Resale Flat, such as floor areas and resale price.
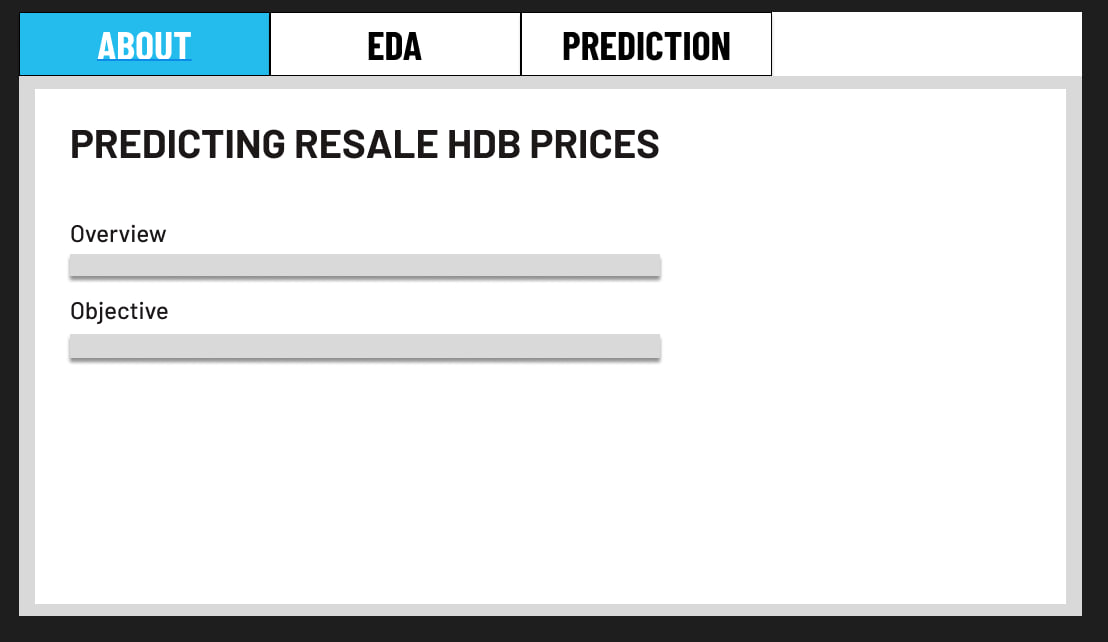
With the goals in mind, we hope that we are able to provide an interactive map of the geographical region with the price of the resale HDB and provide an reference value to the buyer on whether the asking price of the HDB is reasonable or not given the factors of the HDB Flat. This we hope will all users to make better decisions when purchasing a resale of HDB.
4 Approach to Solve the Problem
Now that we has establish our problem, here is our predicted issue
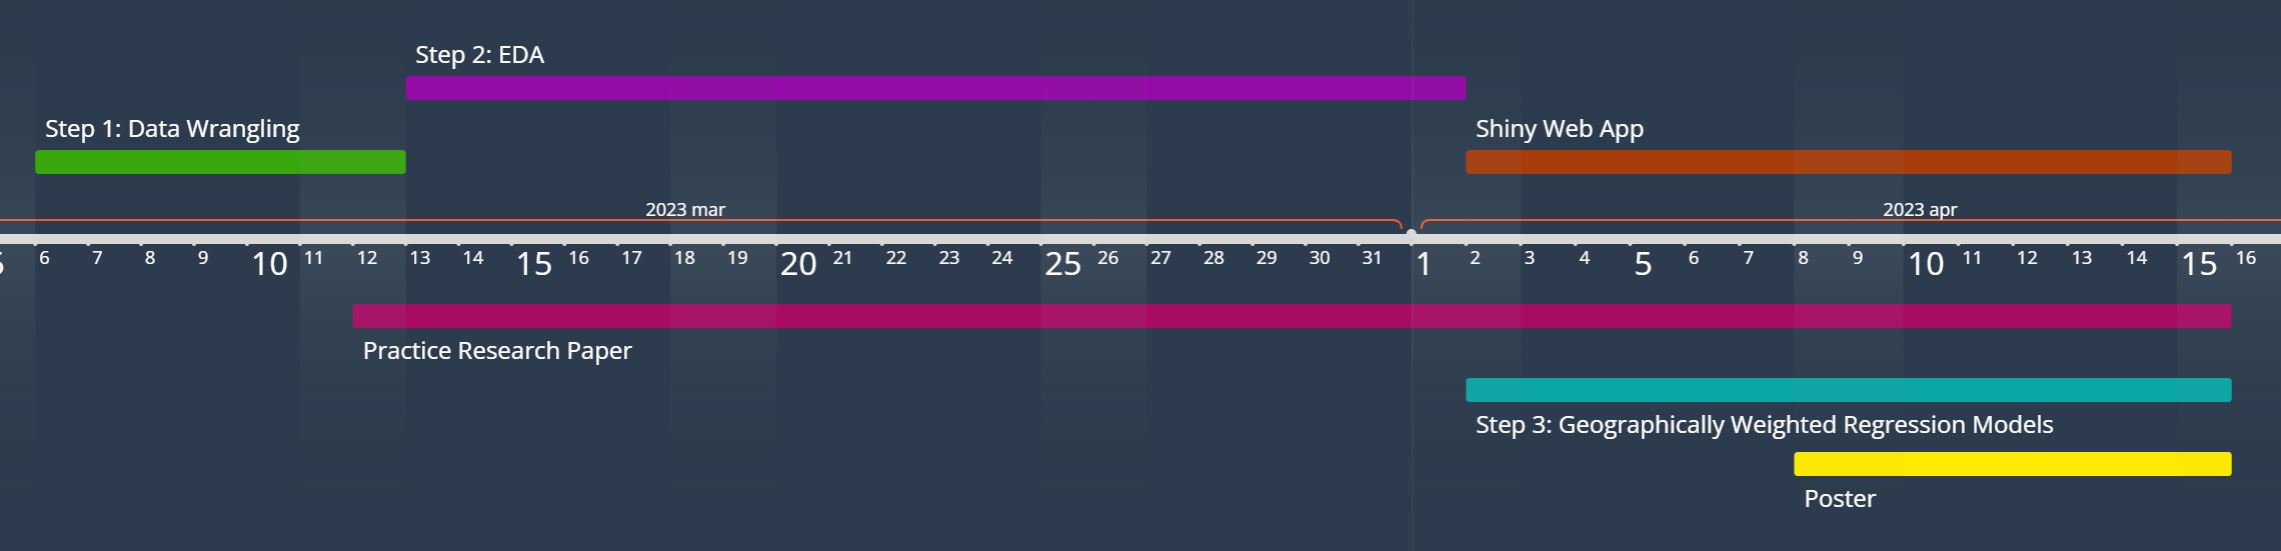
4.1 Step 1: Data Wrangling (6th March to 12th March)
This is expected to take a large chunk of our time, as we have data set in multiple files. We will need to remove unnecessary data and also filter out all the relevant fields as not all fields is necessary in our analysis. We would need to remove all the outer islands from the map of Singapore as well.
After we have cleaned up the data, we would need to create relevant fields in the maps HDB data set does not have any geospatial data, and we would need to make use of the relevant R packages to detect the coordinates of the HDB for display as well. Other data sets might not also have such data as well and we would need to fixed the issues as well.
Lastly, we would need to make the necessary computation to calculate all the relevant fields such as distance from our identified factors as well.
4.2 Step 2: EDA (13th March to 2nd April)
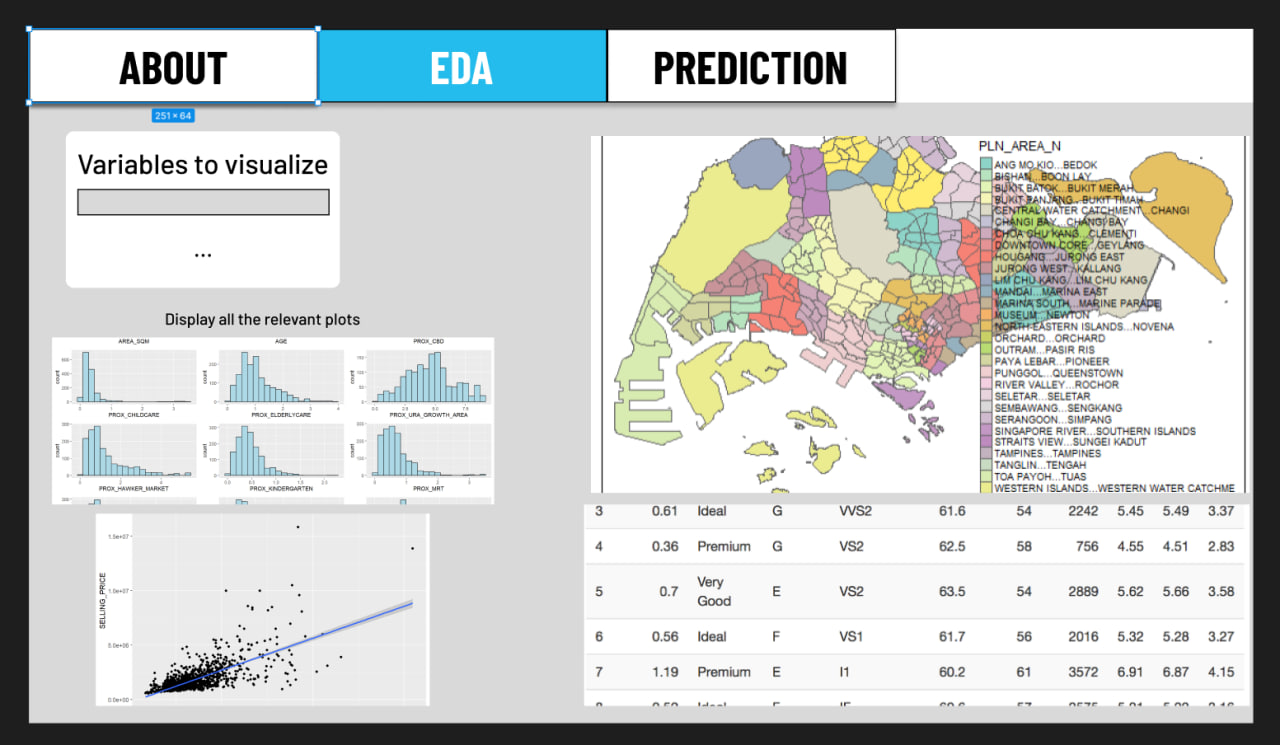
After we have finish wrangling the data, we would need to see how correlated the factors are with the price of the HDB. We will first visualized the relationships of the independent variables first.
We need to avoid using highly correlated independent variables to prevent the compromised of the quality of the model. Variables that are highly correlated with each other will need to be handled by removing one of the highly correlated models.
We would need to perform multiple steps in order to ensure that the regression model is the most accurate, namely (all this is reference from R for Geospatial Data Science and Analytics by Dr Kam Tin Seong):
comprehensive regression output
residual diagnostics
measures of influence
heteroskedasticity tests
collinearity diagnostics
model fit assessment
variable contribution assessment
variable selection procedures
4.3 Step 3: Geographically Weighted Regression Models (2nd April to 16th April)
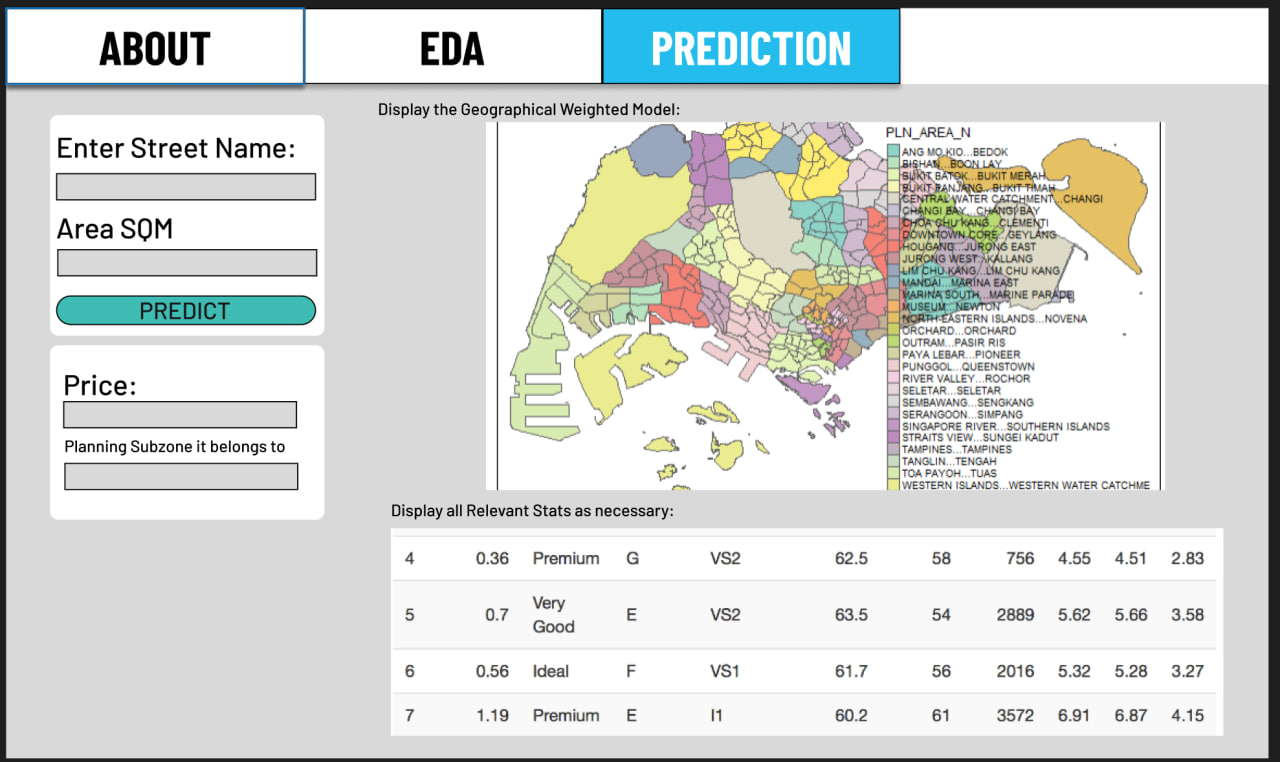
After we have perform our EDA, and selected all the proper variable we can finally build a proper regression model. As we have already perform all the necessary tuning of the model during the EDA steps, we would need to build the model and check out the initial generation of data. We would need to interpret the data into a easier to understand format as well. Once we are done with it, we can start the make the model interactive.
We will need to convert it into a shiny web app, and allow users to modify the variable so that they may get the prediction based on their selected variables.
4.4 Time Line
5 Story Boarding
5.1 HOME PAGE
5.2 EDA Page (Visualize EDA Data)
5.3 Prediction Page (Shows the prediction)